Monitor Cassandra using the kube-prometheus-stack
While K8ssandra v1 managed the deployment of the kube-prometheus stack, that ability was removed in k8ssandra-operator.
The following guide will show you how to install Prometheus and Grafana on your Kubernetes cluster using the kube-prometheus-stack set of Helm charts.
Prerequisites
The k8ssandra-operator should be installed in the k8ssanda-operator namespace.
See the installation documentation for more information.
Installing and configuring the kube-prometheus-stack
k8ssandra-operator has integrations with Prometheus which allow for the simple rollout of Prometheus ServiceMonitors for Stargate, Cassandra and Reaper.
ServiceMonitors are custom resources of prometheus-operator which describe the set of targets to be scraped by Prometheus.
The prometheus-operator is a core component of the kube-prometheus-stack.
Install the kube-prometheus-stack
We will install the kube-prometheus-stack in the same k8ssandra-operator namespace in order to simplify this guide.
Create the following kube-prom-stack-values.yaml file:
prometheus:
  prometheusSpec:
    serviceMonitorSelectorNilUsesHelmValues: false
    serviceMonitorSelector: {}
    serviceMonitorNamespaceSelector: {}
grafana:
  enabled: true
  adminUser: admin
  adminPassword: secret
  defaultDashboardsEnabled: false
  # -- Additional plugins to be installed during Grafana startup,
  # `grafana-polystat-panel` is used by the default Cassandra dashboards.
  plugins:
    - grafana-polystat-panel
  grafana.ini: {}
  image:
    repository: grafana/grafana
    tag: 7.5.11
    sha: ""
    pullPolicy: IfNotPresent
Download this file here.
Add the prometheus-community Helm repository:
helm repo add prometheus-community https://prometheus-community.github.io/helm-charts
helm repo update
Then, install the kube-prometheus-stack using the following command, and referencing the kube-prom-stack-values.yaml file:
helm install prometheus-grafana prometheus-community/kube-prometheus-stack -n k8ssandra-operator -f kube-prom-stack-values.yaml
This will install all the monitoring components in the k8ssandra-operator namespace.
Creating a K8ssandraCluster with telemetry enabled
The following guide assumes k8ssandra-operator is already installed, and a K8ssandraCluster object was created with the following manifest, in the k8ssandra-operator namespace:
apiVersion: k8ssandra.io/v1alpha1
kind: K8ssandraCluster
metadata:
  name: test
  namespace: k8ssandra-operator
spec:
  cassandra:
    serverVersion: "4.0.3"
    serverImage: k8ssandra/cass-management-api:4.0.3
    telemetry:
      prometheus:
        enabled: true
    storageConfig:
      cassandraDataVolumeClaimSpec:
        storageClassName: standard
        accessModes:
          - ReadWriteOnce
        resources:
          requests:
            storage: 1Gi
    config:
      jvmOptions:
        heapSize: 512M
    datacenters:
      - metadata:
          name: dc1
        size: 3
    mgmtAPIHeap: 64Mi
  stargate:
    size: 1
    telemetry:
      prometheus:
        enabled: true
  reaper:
    keyspace: reaper_db
    telemetry:
      prometheus:
        enabled: true
Download this manifest here.
Setting telemetry.prometheus.enabled to true on the .spec.cassandra, .spec.stargate and .spec.reaper sections of the K8ssandraCluster CR will automatically create the ServiceMonitors.
Note: Reaper’s telemetry block was added in K8ssandra v1.2.0 and Reaper v3.2.0.
You can selectively enable service monitor creation for each component without any requirement to enable them all.
Wait for the pods to come up in the k8ssandra-operator namespace and fully start.
Running kubectl get servicemonitor -n k8ssandra-operator should return three ServiceMonitor resources once all the pods are up and running.
You should get the following output:
% kubectl get servicemonitors -n k8ssandra-operator
NAME                                                 AGE
prometheus-grafana                                   7m41s
prometheus-grafana-kube-pr-alertmanager              7m41s
prometheus-grafana-kube-pr-apiserver                 7m41s
prometheus-grafana-kube-pr-coredns                   7m41s
prometheus-grafana-kube-pr-kube-controller-manager   7m41s
prometheus-grafana-kube-pr-kube-etcd                 7m41s
prometheus-grafana-kube-pr-kube-proxy                7m41s
prometheus-grafana-kube-pr-kube-scheduler            7m41s
prometheus-grafana-kube-pr-kubelet                   7m41s
prometheus-grafana-kube-pr-operator                  7m41s
prometheus-grafana-kube-pr-prometheus                7m41s
prometheus-grafana-kube-state-metrics                7m41s
prometheus-grafana-prometheus-node-exporter          7m41s
test-dc1-cass-servicemonitor                         5m47s
test-dc1-reaper-reaper-servicemonitor                5m47s
test-dc1-stargate-stargate-servicemonitor            5m47s
Install the Grafana dashboards
Grafana will pick up dashboards passed as configmaps that have the label grafana_dashboard: "1".
When using MCAC, create the overview, condensed and stargate dashboards (download the manifest here) configmaps:
kubectl apply -f grafana-dashboards.yaml -n k8ssandra-operator
When using the new metrics endpoint (and MCAC is disabled), create the overview, condensed and stargate dashboards (download the manifest here) configmaps:
kubectl apply -f grafana-dashboards-new.yaml -n k8ssandra-operator
The new metrics endpoint doesn’t extract os level metrics (cpu, memory, disk, etc) so the overview dashboard will be missing those metrics by default. The Prometheus node_exporter can be deployed to expose those metrics for scraping, and the corresponding charts will have to be adjusted accordingly in the dashboard.
An alternative is to enable Vector instead and include the following components in the Vector configuration:
      vector:
        components:
          sources:
            - config: |-
                filesystem.devices.excludes = ["binfmt_misc"]
                filesystem.filesystems.excludes = ["binfmt_misc"]
                filesystem.mountpoints.excludes = ["*/proc/sys/fs/binfmt_misc"]
                scrape_interval_secs = 30
              name: host_metrics
              type: host_metrics
          transforms:
            - config: |-
                source = """
                .tags.cluster = get_env_var!("CLUSTER_NAME")
                .tags.datacenter = get_env_var!("DATACENTER_NAME")
                .tags.rack = get_env_var!("RACK_NAME")
                """
              inputs:
                - host_metrics
              name: enrich_host_metrics
              type: remap
The enrich_host_metrics transform then needs to be used as input for a Prometheus remote write sink which will send the metrics to the Prometheus server.
The resulting metrics will be used by the overview dashboard out of the box without requiring any modification.
You can port-forward the Grafana service to access the dashboard at http://localhost:3000: kubectl port-forward svc/grafana-service 3000:3000
Log in with the credentials defined in the values file: admin / secret
You should then see the following list of available dashboards:
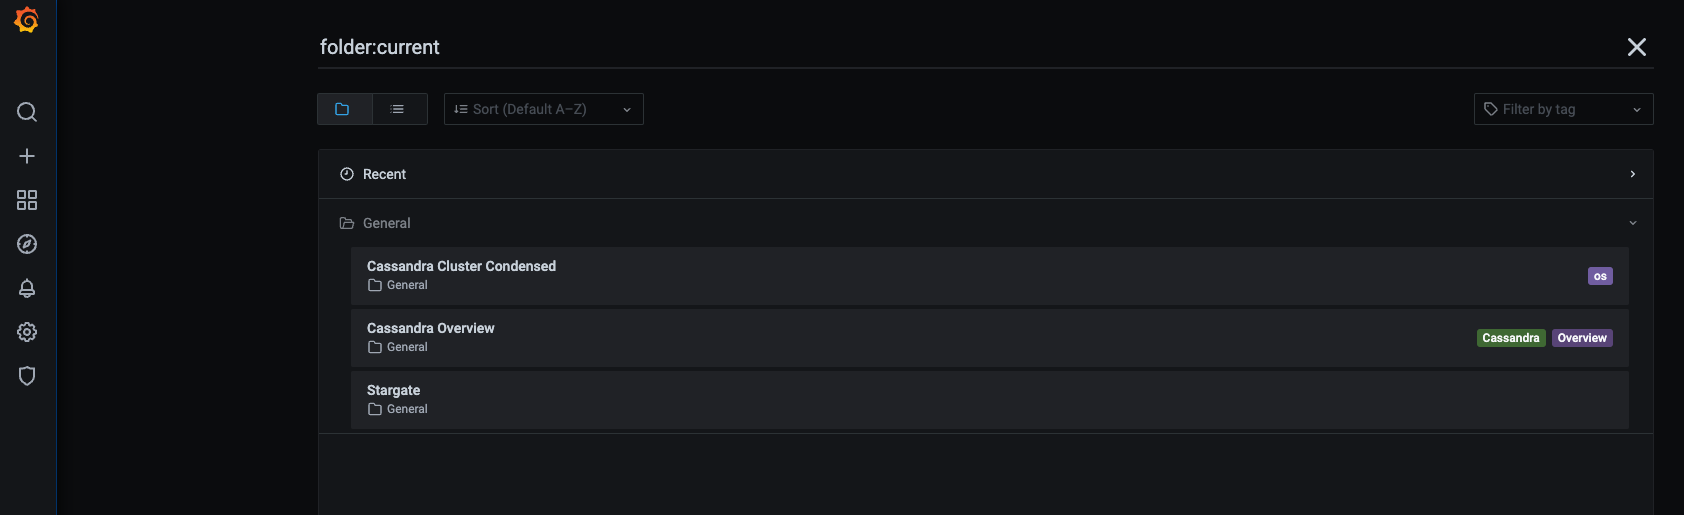
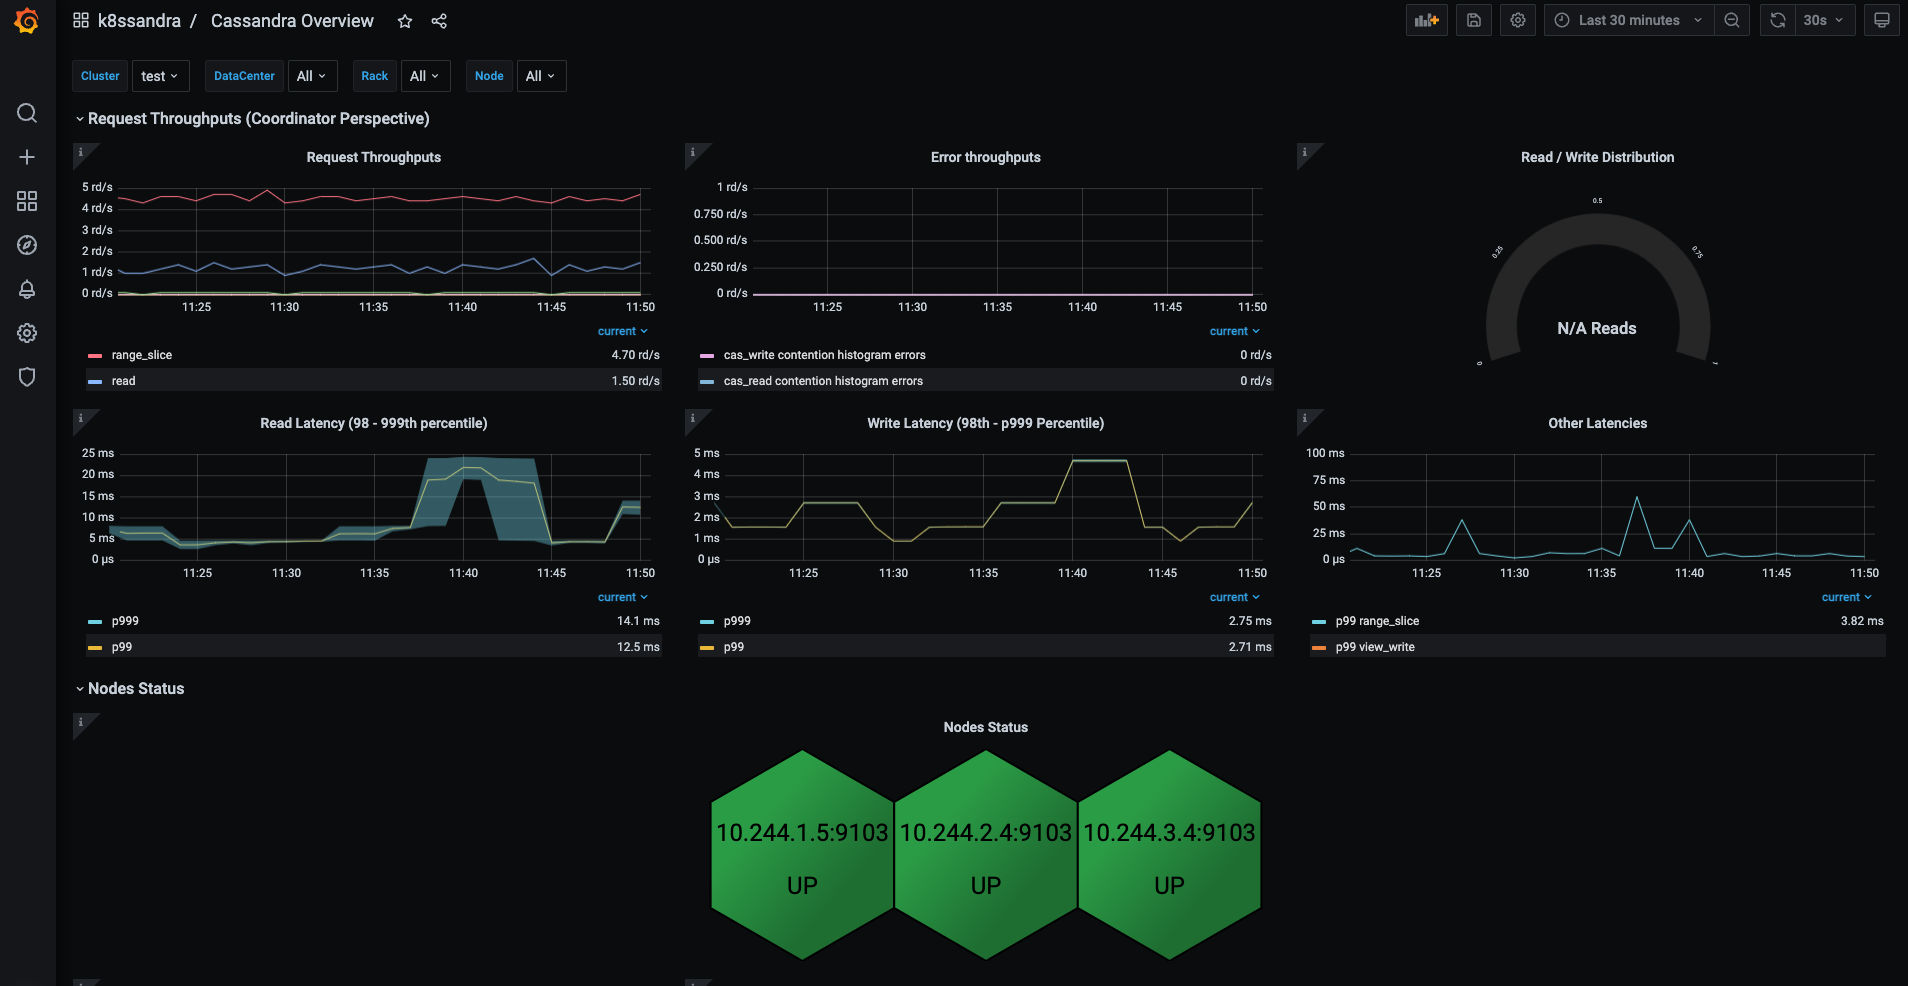
Clicking on the Overview Dashboard should get you to a screen similar to this:
Filtering metrics with MCAC
Cassandra provides a lot of metrics which can create some overload, especially when there are many tables in a cluster. Filtering rules for MCAC can be defined in the telemetry spec:
apiVersion: k8ssandra.io/v1alpha1
kind: K8ssandraCluster
metadata:
  name: test
spec:
  cassandra:
    telemetry:
      prometheus:
        enabled: true
        mcacMetricFilters:
          - "deny:org.apache.cassandra.metrics.Table"
          - "allow:org.apache.cassandra.metrics.Table.LiveSSTableCount"
When no filter is explicitly defined in the spec, default K8ssandra v1.x filters will be applied:
 - "deny:org.apache.cassandra.metrics.Table"
 - "deny:org.apache.cassandra.metrics.table"
 - "allow:org.apache.cassandra.metrics.table.live_ss_table_count"
 - "allow:org.apache.cassandra.metrics.Table.LiveSSTableCount"
 - "allow:org.apache.cassandra.metrics.table.live_disk_space_used"
 - "allow:org.apache.cassandra.metrics.table.LiveDiskSpaceUsed"
 - "allow:org.apache.cassandra.metrics.Table.Pending"
 - "allow:org.apache.cassandra.metrics.Table.Memtable"
 - "allow:org.apache.cassandra.metrics.Table.Compaction"
 - "allow:org.apache.cassandra.metrics.table.read"
 - "allow:org.apache.cassandra.metrics.table.write"
 - "allow:org.apache.cassandra.metrics.table.range"
 - "allow:org.apache.cassandra.metrics.table.coordinator"
 - "allow:org.apache.cassandra.metrics.table.dropped_mutations"
The above filtering rules don’t apply to the new metrics endpoint introduced in v1.5.0.
Filtering metrics with the new metrics endpoint from v1.5.0
The new metrics endpoint supports configuration override via a configmap, which can be used to define filtering rules through Prometheus relabeling rules:
relabels:
  - sourceLabels: ["__tag1__", "__tag2__"]
    separator: ";"
    regex: "(.*);(b.*)"
    action: "drop"
  - sourceLabels: ["__tag1__", "__tag2__"]
    separator: ","
    regex: "^(a|b|c),.*"
    action: "drop"
Next steps
- Explore other K8ssandra Operator tasks.
- See the Reference topics for information about K8ssandra Operator Custom Resource Definitions (CRDs) and the single K8ssandra Operator Helm chart.
Feedback
Was this page helpful?
Glad to hear it! Please tell us how we can improve.
Sorry to hear that. Please tell us how we can improve.